Advanced Report – Create customized reports for one or multiple indicators
You can create a customized report that will suit your preferences and provide data for multiple indicators.
To Create a Report
Navigate to your area of interest.
In the submenu click
 and then select Advanced
Report. The Advanced Report window displays.
and then select Advanced
Report. The Advanced Report window displays.In the Report Title text field enter the Report Title. This is optional but highly recommended to give the report a meaningful identifier.
Select Geography for which you want to perform your analysis. The options available to select depend on the zoom level selected and the data you’ve licensed.
Geography
Minimum Zoom Level
State
4
DMA
4
Congressional District
4
Metro Area
4
County
4
ZIP Code
5
Populated ZIP Code
5
Census Tract
8
Block Group
10
Block
14
Optional - Select the Add to Report check box to include the name of an additional higher level geography in report. Options listed depend on license and current geography selected. Custom Geography names may also be included in report when the selected geography is the same as the one used to define your custom uploaded geography.
Select year check box(es). Selection of years hides and reveals indicators displayed in the corresponding databases.
Select data type, either counts and/or percentage check box. Selection of data type hides and reveals corresponding indicators.
Under Indicator, click
 to expand American Marketscape
DataStream, Consumer Spending Dynamix, User
Defined or corresponding database .
to expand American Marketscape
DataStream, Consumer Spending Dynamix, User
Defined or corresponding database .Click the plus (+) next to the
 to expand Groups. Continue to expand Groups
until individual indicators display. Please refer to the GIS Reference Guide, for a list of all indicators
or use the Search feature to locate desired information. Various
symbols display next to indicators :
to expand Groups. Continue to expand Groups
until individual indicators display. Please refer to the GIS Reference Guide, for a list of all indicators
or use the Search feature to locate desired information. Various
symbols display next to indicators :
numeric indicator 
percentage indicator 
unlicensed indicator 
uploaded data indicator 
virtual indicator 
disabled numeric indicator because indicator is not available at the Geography level currently selected 
disabled percentage indicator because indicator is not available at the Geography level currently selected 
disabled uploaded data indicator because currently selected Geography does not match data uploaded 
Virtual indicator that has been shared with you. Select your Indicators from the list then click Add to include the indicator in the Selected Indicator(s) list. Note - Not all categories and indicators are available for all geographical levels and percentages. An example of this indicator is Total Population, which is only available for Counts but not for Percentages.
Continue repeating steps 7 and 8 until all information you need has been selected. Maximum of 30 indicators may be selected.
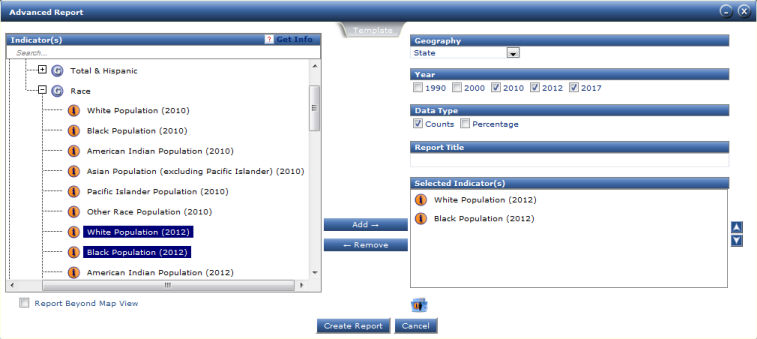
To remove an indicator from the Selected Indicator(s) list box, select the indicator and click Remove.
Click the
 button or
 button to reorder
the sequence of information needed for the report. Report displays in the same order that is
seen in the Selected Indicator(s) box.
button to reorder
the sequence of information needed for the report. Report displays in the same order that is
seen in the Selected Indicator(s) box.
Click Create Report to view data in tabular format.
System displays a new pop-up window or tab showing the data in a grid form where you can sort it online or download to Excel for further adjustments or printing.
To sort the report in descending order, click on the column header you want the report to be sorted by. Click the column heading again to sort in ascending order.
To swap columns and rows in the report window, at the bottom of the window click Transpose
 icon. Note
the transpose function only modifies the layout of report in the
preview window, the report exports to Excel in original format.
icon. Note
the transpose function only modifies the layout of report in the
preview window, the report exports to Excel in original format. To export to Microsoft Excel, click the
 icon on the lower right-hand
corner next to Download Report.
icon on the lower right-hand
corner next to Download Report.To save the report to your account for later retrieval from My Projects, click the
 on the lower right-hand corner next to Save
Report.
on the lower right-hand corner next to Save
Report.
Note - Advanced report will also apply any conditional filters entered in Map Query. Parameters entered in Map query will display below the Report Title.
Create
User Defined Group with List of Selected Indicator
User-defined groups let you create your own virtual category by letting you group together indicators from different categories. This is a useful feature as it lets you save a set of indicators that you use often in analysis thus saving you time from having to select each individual one every time you run a report.
To create a user defined group with the indicators currently selected in the Advanced Report window, click the Create User Group
 icon found above the Cancel
button.
icon found above the Cancel
button.The User Defined Group window displays. In the Group Name text box enter the name of your user-defined group
![]()
At the bottom of window click Add to create your user-defined group.