Data Settings – (Choosing Demographics)
The Data Settings tab allows you to select which socio-demographic or economic data you want to display on the map.
To Explore Demographics or Choose Your Data
Select year check box(es). Selection of years hides and reveals indicators displayed in the corresponding databases.
Select data type, either counts and/or percentage check box. Selection of data type hides and reveals corresponding indicators.
Select Geography for which you want to perform your analysis. The options available to select depend on the zoom level selected and the data you’ve licensed.
Geography
Minimum Zoom Level
State
4
DMA
4
Congressional District
4
Metro Area
4
County
4
ZIP Code
5
Populated ZIP Code
5
Census Tract
8
Block Group
10
Block
14
Custom Geography (if defined)
all
Under Indicator, click
 to
expand American Marketscape
DataStream, Consumer Spending Dynamix, User
Defined or corresponding database.
to
expand American Marketscape
DataStream, Consumer Spending Dynamix, User
Defined or corresponding database.Click the plus (+) next to the
 to expand Groups. Continue to expand Groups until individual
indicators display. Please refer to the GIS
Reference Guide, for a list of all indicators or use the Search feature to locate desired information.
Various symbols display next to indicators :
to expand Groups. Continue to expand Groups until individual
indicators display. Please refer to the GIS
Reference Guide, for a list of all indicators or use the Search feature to locate desired information.
Various symbols display next to indicators :
numeric indicator 
percentage indicator 
unlicensed indicator 
uploaded data indicator 
virtual indicator 
disabled numeric indicator because indicator is not available at the Geography level currently selected 
disabled percentage indicator because indicator is not available at the Geography level currently selected 
disabled uploaded data indicator because currently selected Geography does not match data uploaded 
Virtual indicator that has been shared with you. Click desired indicator to select. Note - Not all categories and indicators are available for all geographical levels and percentages. An example of this indicator is Total Population, which is only available for Counts but not for Percentages.
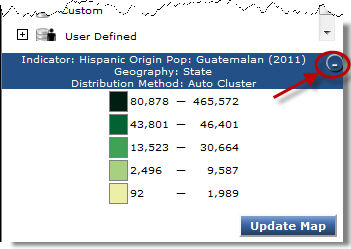
Click Update Map.
To Get Information about the Selected Indicator
Click
 link to get the details about the currently
selected indicator. Indicator Information window displays.
link to get the details about the currently
selected indicator. Indicator Information window displays. 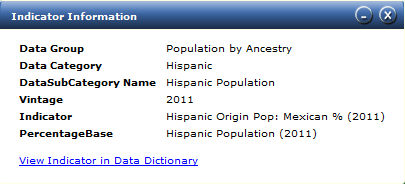
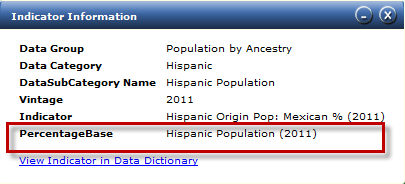
Note the Indicator Information window reveals the base (denominator) used to calculate the percentage for percentage indicators.
The legend floats on map but it may be moved, minimized or anchored to the Data Settings tab in the Flyout tools.
To move the legend click and drag it to place it in the desired location.
To minimize legend window click
 .
.To anchor legend back to the Data Setting tab click
 on the map legend window.
To detach on the legend header click
.